Slot Bonus Round Trigger Frequency Statistics
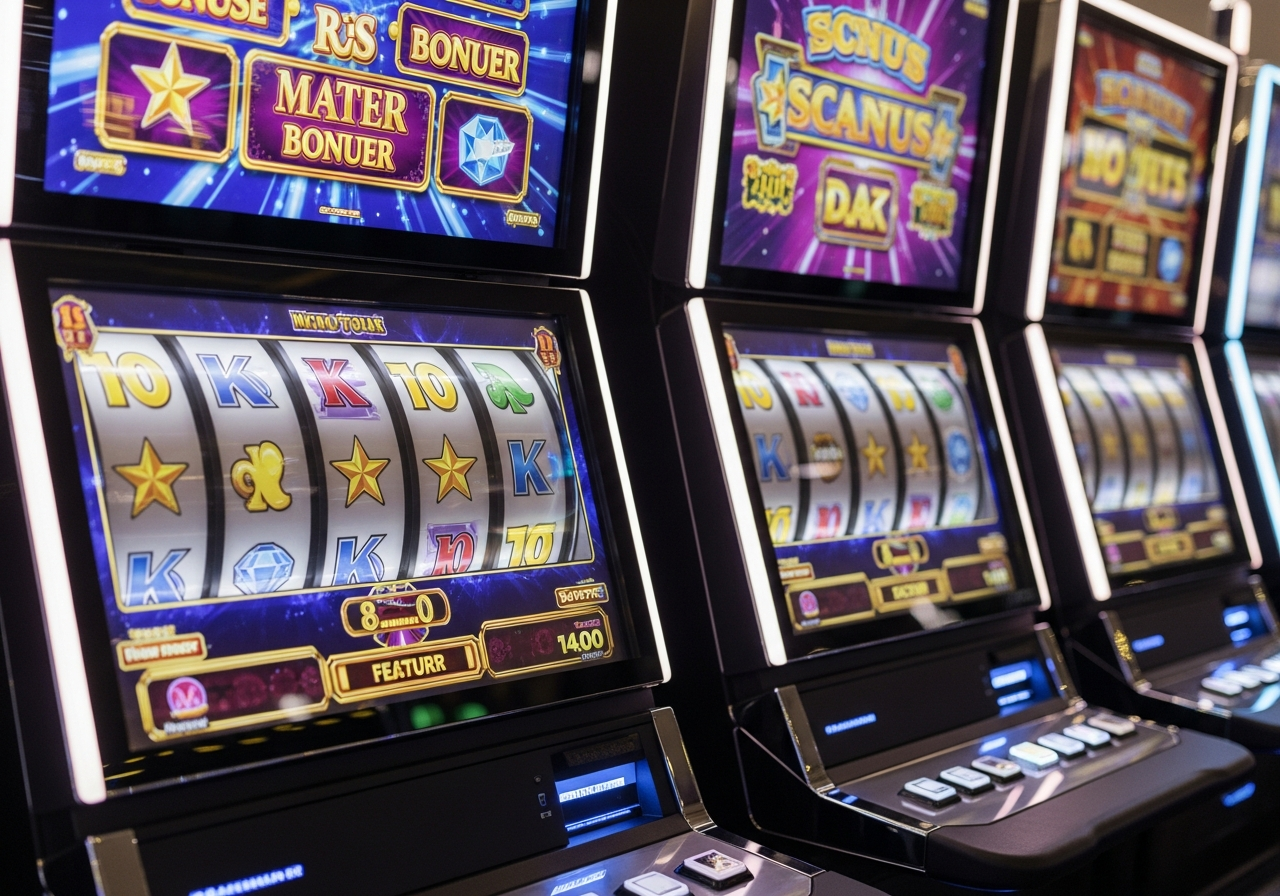
Slot bonus round trigger frequency represents the statistical measurement of how often bonus features activate during regular gameplay, typically expressed as the number of base game spins required between bonus events. Understanding this metric is crucial for developing effective slot strategy, as it directly impacts both bankroll management and session planning expectations.
The frequency at which bonus rounds trigger varies significantly across different games, denominations, and jurisdictions throughout the United States. Modern slot machines utilize sophisticated programming that distributes payouts between base game hits and bonus features, with roughly one-third of total slot RTP commonly originating from bonus rounds in US casino games, making these special features essential components of overall slot machine profitability.
Understanding Slot Bonus Round Trigger Frequency
Trigger frequency in slot machines refers to the average number of spins required to activate a bonus round, though this measurement represents theoretical expectations rather than guaranteed intervals. The mathematical models used by slot manufacturers calculate these frequencies based on millions of simulated spins, creating statistical averages that may not reflect individual player experiences during shorter gaming sessions.
Theoretical odds provided by manufacturers often contrast sharply with player experience due to the inherent volatility in random number generation. A slot machine programmed to trigger bonuses every 100 spins on average might deliver consecutive bonuses within 20 spins, followed by a drought lasting 300 spins, yet still maintain its mathematical integrity over extended play.
The relationship between trigger frequency and payback percentage becomes particularly pronounced when players reduce the number of active paylines. Many bonus features require specific symbol combinations across multiple reels and paylines, meaning fewer active lines can significantly reduce bonus trigger opportunities while simultaneously decreasing the machine’s effective RTP.
This mathematical relationship creates a compounding effect where reduced paylines not only decrease base game winning opportunities but also limit access to the bonus rounds that typically contribute the largest portion of a slot machine’s overall return to player percentage.
What Determines Bonus Trigger Frequency?
Random Number Generator mechanics form the foundation of bonus trigger frequency, with each major manufacturer employing proprietary algorithms that determine when bonus symbols appear on the reels. These RNG systems operate independently for each spin, ensuring that previous results cannot influence future outcomes, though the underlying probability tables remain constant throughout gameplay.
Game volatility significantly impacts bonus expectations, with high-volatility slots typically featuring less frequent but more valuable bonus rounds, while low-volatility games tend to trigger bonuses more regularly with smaller average payouts. This design philosophy allows manufacturers to create different player experiences while maintaining similar overall RTP percentages across their game portfolios.
Impact of Payline Selection on Bonus Frequency
The relationship between payline selection and bonus triggering creates one of the most significant strategic considerations for slot players. Most modern video slots require bonus symbols to appear on active paylines to trigger their special features, meaning reduced payline play directly correlates with decreased bonus activation opportunities.
When players choose to activate fewer than the maximum available paylines, they effectively reduce their access to bonus rounds while simultaneously decreasing the machine’s RTP. This reduction compounds over time, as the missed bonus opportunities represent the highest-value portions of the slot’s payout structure, creating a mathematical disadvantage that extends beyond simple base game considerations.
RTP Distribution Between Base Game and Bonus Rounds
Major US slot manufacturers consistently demonstrate a standard distribution pattern where approximately two-thirds of total RTP derives from base game payouts, while the remaining one-third originates from bonus round contributions. This split varies slightly based on game themes and volatility profiles, but the fundamental structure remains remarkably consistent across different manufacturers and jurisdictions.
The distribution model reflects decades of player behavior research and operational data, showing that sustained engagement requires frequent base game hits supplemented by exciting bonus events. Games that deviate significantly from this proven formula often struggle to maintain player interest over extended gaming sessions, regardless of their mathematical soundness.
| Slot Game Title | Base Game RTP % | Bonus Round RTP % | Total Game RTP % |
|---|---|---|---|
| Buffalo Gold | 60.2% | 29.8% | 90.0% |
| Wheel of Fortune | 58.7% | 29.3% | 88.0% |
| Lightning Link | 61.5% | 30.5% | 92.0% |
| Quick Hit Platinum | 59.1% | 28.9% | 88.0% |
| Dancing Drums | 60.8% | 31.2% | 92.0% |
| 88 Fortunes | 58.3% | 29.7% | 88.0% |
| Dragon Link | 61.2% | 30.8% | 92.0% |
| Triple Red Hot 777 | 59.8% | 28.2% | 88.0% |
Bonus Round Contribution to Overall Payback
The one-third payback contribution pattern becomes particularly evident when examining 90% RTP slots, where bonus rounds typically account for approximately 30% of total returns. This distribution creates a mathematical scenario where players who miss bonus opportunities due to reduced payline play or premature session endings experience significantly lower actual RTP than the machine’s theoretical rating suggests.
Calculation samples across various denominations reveal consistent patterns in bonus contribution ratios, though higher denomination slots often allocate slightly higher percentages to bonus rounds to justify their increased betting requirements. For example, a typical penny slot might distribute 28% of RTP through bonuses, while a $5 denomination machine could allocate 32% to bonus features, creating enhanced value propositions for higher-stakes players.
Average Bonus Trigger Frequency by Spin Rate
Bonus trigger intervals vary significantly across different slot types and manufacturers, with most standard video slots programmed to activate bonus features between every 80 to 150 spins on average. These intervals represent mathematical expectations based on millions of simulated spins, though individual player experiences may deviate substantially from these averages during typical gaming sessions.
Player feedback consistently indicates that perceived bonus frequency often differs from theoretical calculations, particularly during shorter gaming sessions where natural variance can create extended periods without bonus activation. This disconnect between mathematical reality and player experience influences game design decisions and marketing strategies across the industry.
- Standard video slots: Bonus triggers every 100-120 spins on average
- High-volatility games: Bonus activation every 150-200 spins with larger payouts
- Low-volatility slots: More frequent triggers every 60-80 spins with smaller bonuses
- Progressive jackpot games: Extended intervals of 200+ spins between bonus events
- Multi-level bonus games: Primary bonuses every 90-110 spins, secondary features less frequent
Bonus Event Duration and Spin Hour Impact
Bonus events significantly impact overall spins per hour calculations, with free spin bonuses typically lasting 15-45 seconds depending on the number of spins awarded and animation complexity. Pick’em style bonuses generally conclude more quickly, usually within 10-20 seconds, allowing for higher overall spin rates during extended gaming sessions.
The duration differences between bonus types create measurable impacts on hourly coin-in calculations, with slots featuring elaborate bonus animations effectively reducing total spins per hour by 8-12%. This reduction affects both player bankroll consumption rates and casino revenue calculations, influencing floor placement and promotional strategies.
Extended bonus features like wheel spins or multi-level pick games can consume 60-90 seconds per activation, significantly altering the pace of play and creating natural session breaks that may influence player retention and satisfaction levels.
Variance Between Game Themes and Manufacturers
Different manufacturers employ distinct philosophies regarding bonus frequency, with some prioritizing frequent small bonuses while others focus on less frequent but more substantial bonus events. These philosophical differences reflect varying approaches to player engagement and retention strategies developed through extensive market research and player behavior analysis.
Game themes also influence frequency expectations, with adventure-themed slots often featuring more complex bonus structures that activate less frequently but provide enhanced entertainment value through interactive elements and extended play sequences.
US Casino Payback Statistics by Jurisdiction
Regional payback data across multiple US states reveals significant variations in slot machine programming based on local regulations, competitive environments, and market conditions. These jurisdictional differences affect both overall RTP percentages and the distribution of returns between base games and bonus rounds, creating distinct gaming experiences for players in different regions.
The combination of land-based and riverboat casino data provides comprehensive insights into how regulatory frameworks influence machine configurations and bonus frequency programming. States with higher minimum RTP requirements often feature more generous bonus round allocations to maintain competitive appeal while meeting regulatory standards.
| US State/Region | Denomination | Average Payback % |
|---|---|---|
| Nevada | $0.01 | 88.2% |
| Nevada | $0.25 | 92.1% |
| Nevada | $1.00 | 94.8% |
| New Jersey | $0.01 | 90.1% |
| New Jersey | $0.25 | 91.8% |
| Pennsylvania | $0.01 | 89.7% |
| Mississippi | $0.01 | 87.3% |
| Louisiana | $0.25 | 90.5% |
| Missouri | $0.01 | 88.9% |
| Illinois | $1.00 | 93.2% |
| Indiana | $0.05 | 89.1% |
| Colorado | $0.25 | 91.7% |
Regional Variations in Bonus Payout Allocation
State-specific regulations create distinct approaches to bonus programming, with some jurisdictions encouraging higher bonus allocations through tax incentives or regulatory preferences. These influences result in measurable differences in bonus trigger frequency and payout distribution between neighboring states, even when using identical slot machine models.
Regulatory oversight varies significantly between jurisdictions, affecting how manufacturers configure bonus features to meet local requirements while maintaining profitability targets. States with stricter RNG testing protocols often feature more conservative bonus programming, while competitive markets may push operators toward more aggressive bonus configurations to attract players.
The impact of regulatory frameworks extends beyond simple RTP requirements, influencing bonus round design elements, trigger mechanisms, and payout structures in ways that create distinctly different gaming experiences across state lines.
Bonus Trigger Frequency by Slot Denomination
Denomination-based analysis reveals consistent patterns in bonus programming across the slot machine industry, with higher denomination games typically featuring more favorable bonus trigger frequencies and enhanced payout potentials. This relationship reflects both economic realities and player expectations at different betting levels, creating tiered gaming experiences that correspond to risk and reward profiles.
The volatility-linked variance data demonstrates how manufacturers adjust bonus mechanics to maintain appropriate risk-reward ratios across denomination levels. Penny slots often employ more frequent but smaller bonuses to sustain player engagement with limited bankrolls, while high-denomination games feature less frequent but substantially more rewarding bonus events.
| Slot Denomination | Typical Payback % | Bonus Frequency Impact |
|---|---|---|
| $0.01 | 88.5% | Every 120-140 spins |
| $0.05 | 89.8% | Every 110-130 spins |
| $0.25 | 91.7% | Every 95-115 spins |
| $1.00 | 94.2% | Every 85-105 spins |
| $5.00 | 95.8% | Every 75-95 spins |
| $25.00 | 97.1% | Every 65-85 spins |
| $100.00 | 98.5% | Every 50-70 spins |
Penny Slots vs High-Denomination Bonus Mechanics
Penny slots demonstrate distinctly different bonus mechanics compared to higher denomination games, with trigger frequencies that appear less favorable due to the extended intervals between bonus activations. This programming approach reflects the need to maintain casino profitability while providing entertainment value for players with limited budgets who typically engage in longer gaming sessions.
The contrast in RTP distribution across denominations reveals how bonus rounds become increasingly important components of overall returns as denomination levels increase. High-denomination slots often allocate 35-40% of total RTP through bonus features, compared to 25-30% for penny slots, creating more dramatic bonus events that justify higher betting requirements.
Analysis of actual gameplay data shows that penny slots compensate for less frequent bonuses through base game hit frequency, maintaining player engagement through regular small wins while building anticipation for more substantial bonus events.
Relationship Between Denomination and RTP Split
The evolution of bonus RTP allocation across denominations demonstrates clear economic principles, with higher denomination games featuring increasingly generous bonus components to attract and retain players willing to risk larger amounts per spin. This relationship creates a natural progression where bonus value and frequency improve proportionally with betting levels.
Economic factors influencing machine programming include operational costs, regulatory requirements, and competitive positioning, all of which favor enhanced bonus structures for higher denomination play where profit margins support more generous return distributions.
Factors Affecting Bonus Round Trigger Frequency
Multiple variables influence how frequently bonus rounds activate during slot machine play, ranging from machine-level programming decisions to player-controlled betting choices. Understanding these factors enables more informed decision-making regarding game selection, betting strategies, and session management approaches.
The distinction between controllable and uncontrollable factors becomes crucial for players seeking to optimize their gaming experiences, as certain variables can be managed through strategic play while others remain fixed components of individual slot machine designs.
- Random Number Generator programming and probability tables set by manufacturers
- Number of active paylines selected by players during each spin
- Total bet amount and coin denomination chosen for gameplay sessions
- Game volatility profile and mathematical model employed by specific titles
- Jurisdictional regulations affecting minimum and maximum RTP requirements
- Casino operator settings within manufacturer-permitted ranges
- Progressive jackpot contributions that may affect bonus trigger calculations
Machine-Level vs Player-Level Variables
Machine-level variables include RNG programming, volatility profiles, and manufacturer specifications that remain constant regardless of individual player decisions. These fixed elements determine the fundamental mathematical structure of each slot machine, establishing the framework within which all bonus triggers operate according to predetermined probability calculations.
Player-level variables encompass betting decisions such as payline selection, coin denomination choices, and total bet amounts that can significantly influence both bonus trigger opportunities and perceived frequency rates. The interaction between these controllable factors and fixed machine parameters creates the actual gaming experience each player encounters.
Line selection and bet size particularly affect bonus trigger perception, as players who reduce active paylines may miss bonus symbol combinations that would have triggered features with maximum line play, creating the impression of reduced bonus frequency when the mathematical reality reflects decreased opportunity rather than altered programming.
Industry Standards and Manufacturer Guidelines
Slot machine manufacturers have developed sophisticated strategies for balancing bonus frequency with player engagement, utilizing decades of behavioral research and mathematical modeling to create optimal gaming experiences. These strategies focus on maintaining sustained player interest while meeting profitability requirements and regulatory compliance standards across multiple jurisdictions.
Current industry trends increasingly favor smaller, more frequent bonus events over traditional models that featured rare but substantial bonus rounds. This shift reflects changing player preferences and the need to maintain engagement in competitive gaming environments where players have numerous entertainment options available.
Balance Between Frequency and Engagement
The relationship between bonus frequency and player engagement represents one of the most critical design considerations in modern slot machine development. Research consistently demonstrates that regular bonus activation maintains player satisfaction more effectively than infrequent large bonuses, leading to programming approaches that emphasize consistent entertainment value over sporadic excitement.
Session length and player retention correlate directly with bonus frequency patterns, as games that provide regular bonus events tend to sustain player interest for extended periods while maintaining positive emotional associations with the gaming experience.
Regulatory Compliance and Minimum Frequency Standards
Unlike RTP minimums that are specifically regulated in most jurisdictions, bonus trigger frequency remains largely unregulated, allowing manufacturers and operators significant flexibility in programming these features. However, RNG fairness requirements ensure that advertised frequencies reflect actual mathematical probabilities over extended play periods.
US regulatory oversight focuses primarily on ensuring that random number generators operate fairly and that advertised RTPs accurately reflect actual machine performance, with bonus frequency falling under general fairness requirements rather than specific regulatory standards.
Practical Implications for Slot Players
Understanding bonus trigger frequency statistics provides valuable insights for developing effective slot machine strategies that can enhance both entertainment value and financial outcomes. These data-driven approaches enable players to make informed decisions about game selection, betting patterns, and session management based on mathematical realities rather than perception or superstition.
Bankroll management and session length optimization become significantly more effective when players understand the statistical foundations underlying bonus round programming and can adjust their expectations and strategies accordingly.
- Always activate all available paylines to ensure access to bonus trigger combinations
- Calculate expected bonus frequency before starting play sessions to set realistic expectations
- Allocate sufficient bankroll to survive typical drought periods between bonus events
- Choose denomination levels that align with your bonus frequency preferences and risk tolerance
- Monitor actual bonus trigger rates during play to identify variance from expected patterns
- Adjust session length expectations based on the specific game’s volatility and bonus frequency profile
Optimizing Play Based on Bonus Trigger Data
Playing all eligible paylines becomes essential for maximizing bonus trigger opportunities, as most modern video slots require bonus symbols to appear on active lines to initiate special features. The mathematical cost of missing bonus rounds through reduced payline play often exceeds the immediate savings from lower per-spin betting amounts, creating a false economy that reduces long-term value.
Calculating the potential cost of missing bonus opportunities reveals that reducing paylines by 25% typically decreases bonus access by a similar percentage, effectively reducing the machine’s RTP by 7-10% when considering the significant contribution bonuses make to overall returns. This analysis demonstrates why maximum payline play represents the most mathematically sound approach for players seeking optimal value from their slot machine sessions.
Session planning based on bonus frequency data enables more effective bankroll management, as players can estimate the number of spins required to experience expected bonus events and adjust their betting patterns to ensure sufficient funds remain available when these higher-value features activate during gameplay.